Crosstab (Cross Tabulation)
Crosstab is a pivot table feature that arranges categorical variables in rows and columns for aggregation. Quickly understand data trends and relationships.
Basic Usage
Opening Crosstab
Select Data > Crosstab from the menu bar to open a new Crosstab tab.
Creating a Cross Tabulation
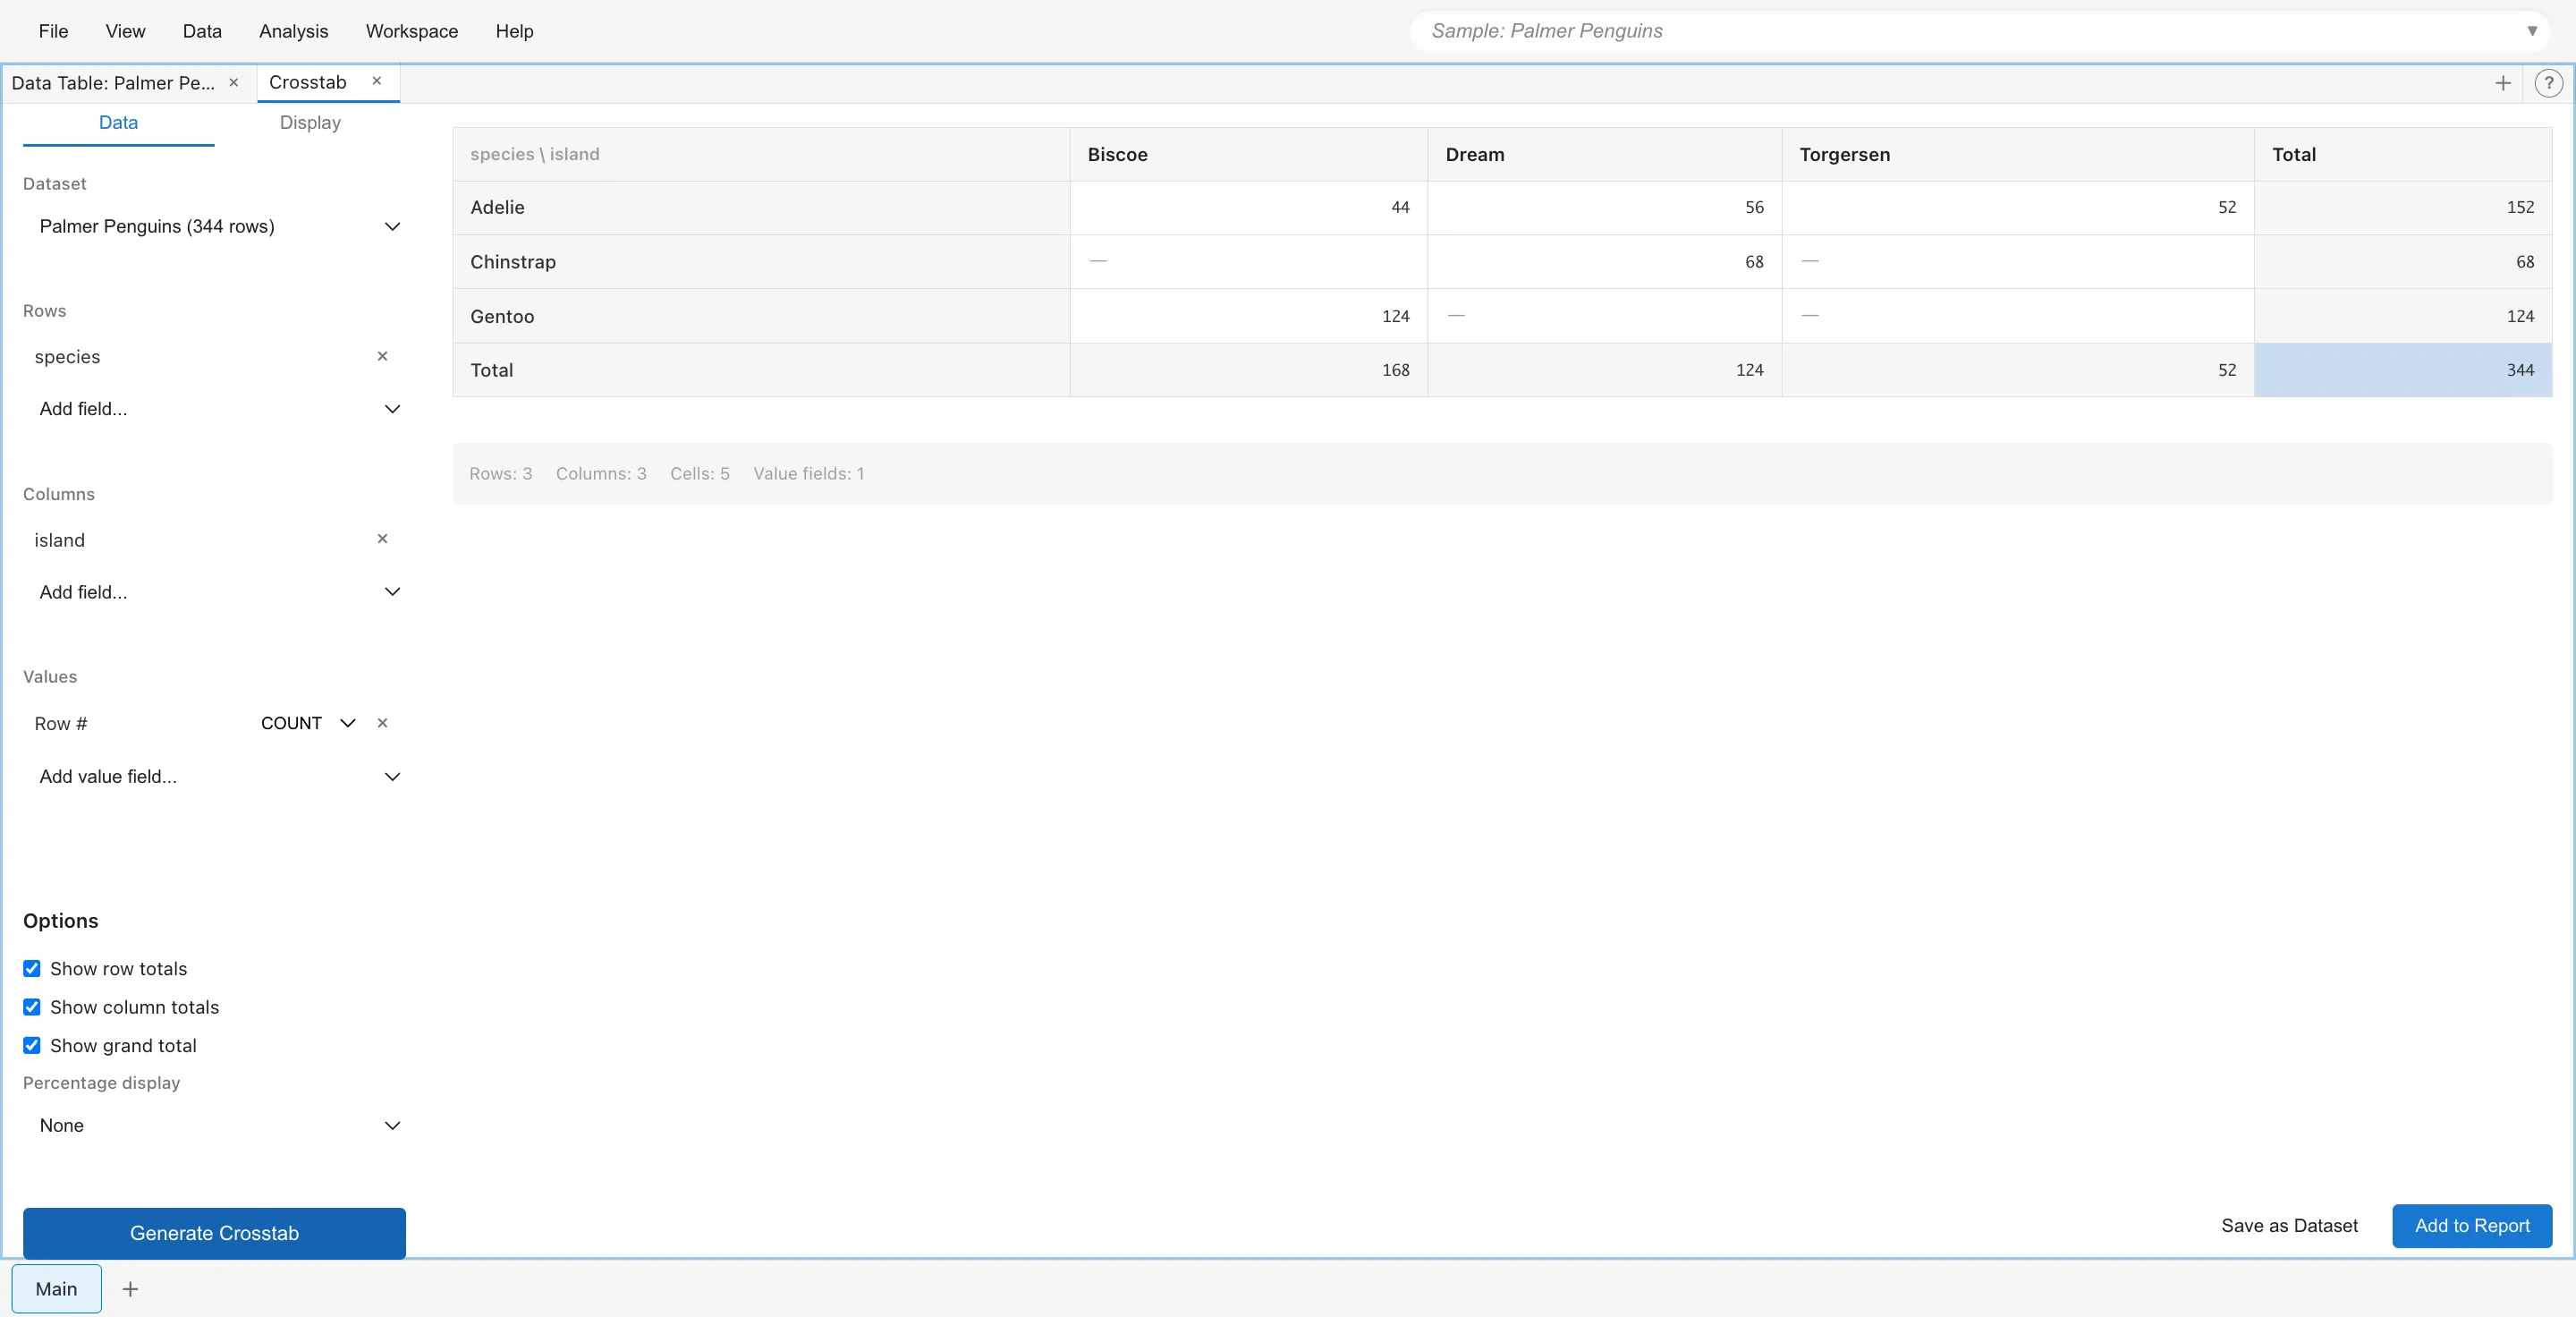
Specify fields in the settings panel on the left.
Rows: Select categorical variables to place in rows. Multiple selections create hierarchical row headers.
Columns: Select categorical variables to place in columns. Multiple selections are also possible.
Values: Select numeric fields to aggregate. You can specify aggregation functions (SUM, AVG, COUNT, MIN, MAX).
When configuration is complete, the cross tabulation table is displayed in the preview area on the right.
Saving Results
Click Save as Dataset to save the cross tabulation results as a new dataset.
Click Add to Report to add the current display to a report.
Aggregation Functions
The following aggregation functions are available for Values fields:
- SUM (total)
- AVG (average)
- COUNT (count)
- MIN (minimum)
- MAX (maximum)
Display Options
Showing Totals
Control total display in the Options section.
Turn on Show row totals to display row totals on the right edge.
Turn on Show column totals to display column totals at the bottom.
Turn on Show grand total to display the overall grand total.
Percentage Display
Percentage display can show values as percentages.
- None - Do not display percentages
- Row % - Display percentage of row total
- Column % - Display percentage of column total
- Total % - Display percentage of grand total
Note: Percentage calculation is not available for AVG, MIN, MAX aggregations.
Sorting
Set sorting options in the Display tab.
Row Sorting
- Original Order - Maintain original data order
- Label (A-Z) - Sort by label in ascending order
- Label (Z-A) - Sort by label in descending order
- Value - Sort by aggregated value
Column Sorting
Same sorting options as rows are available.
For Value sorting, you can specify which column/row value to use as the basis, and whether ascending (Low to High) or descending (High to Low).
Visual Mode
Change display style with Visual Mode in the Display tab. Available only when there is one value field.
- Table - Display in standard table format
- Heatmap - Express value magnitude with cell background color
- Text + Heatmap - Display numbers and heatmap simultaneously
- Bar in Cell - Display bar charts within cells
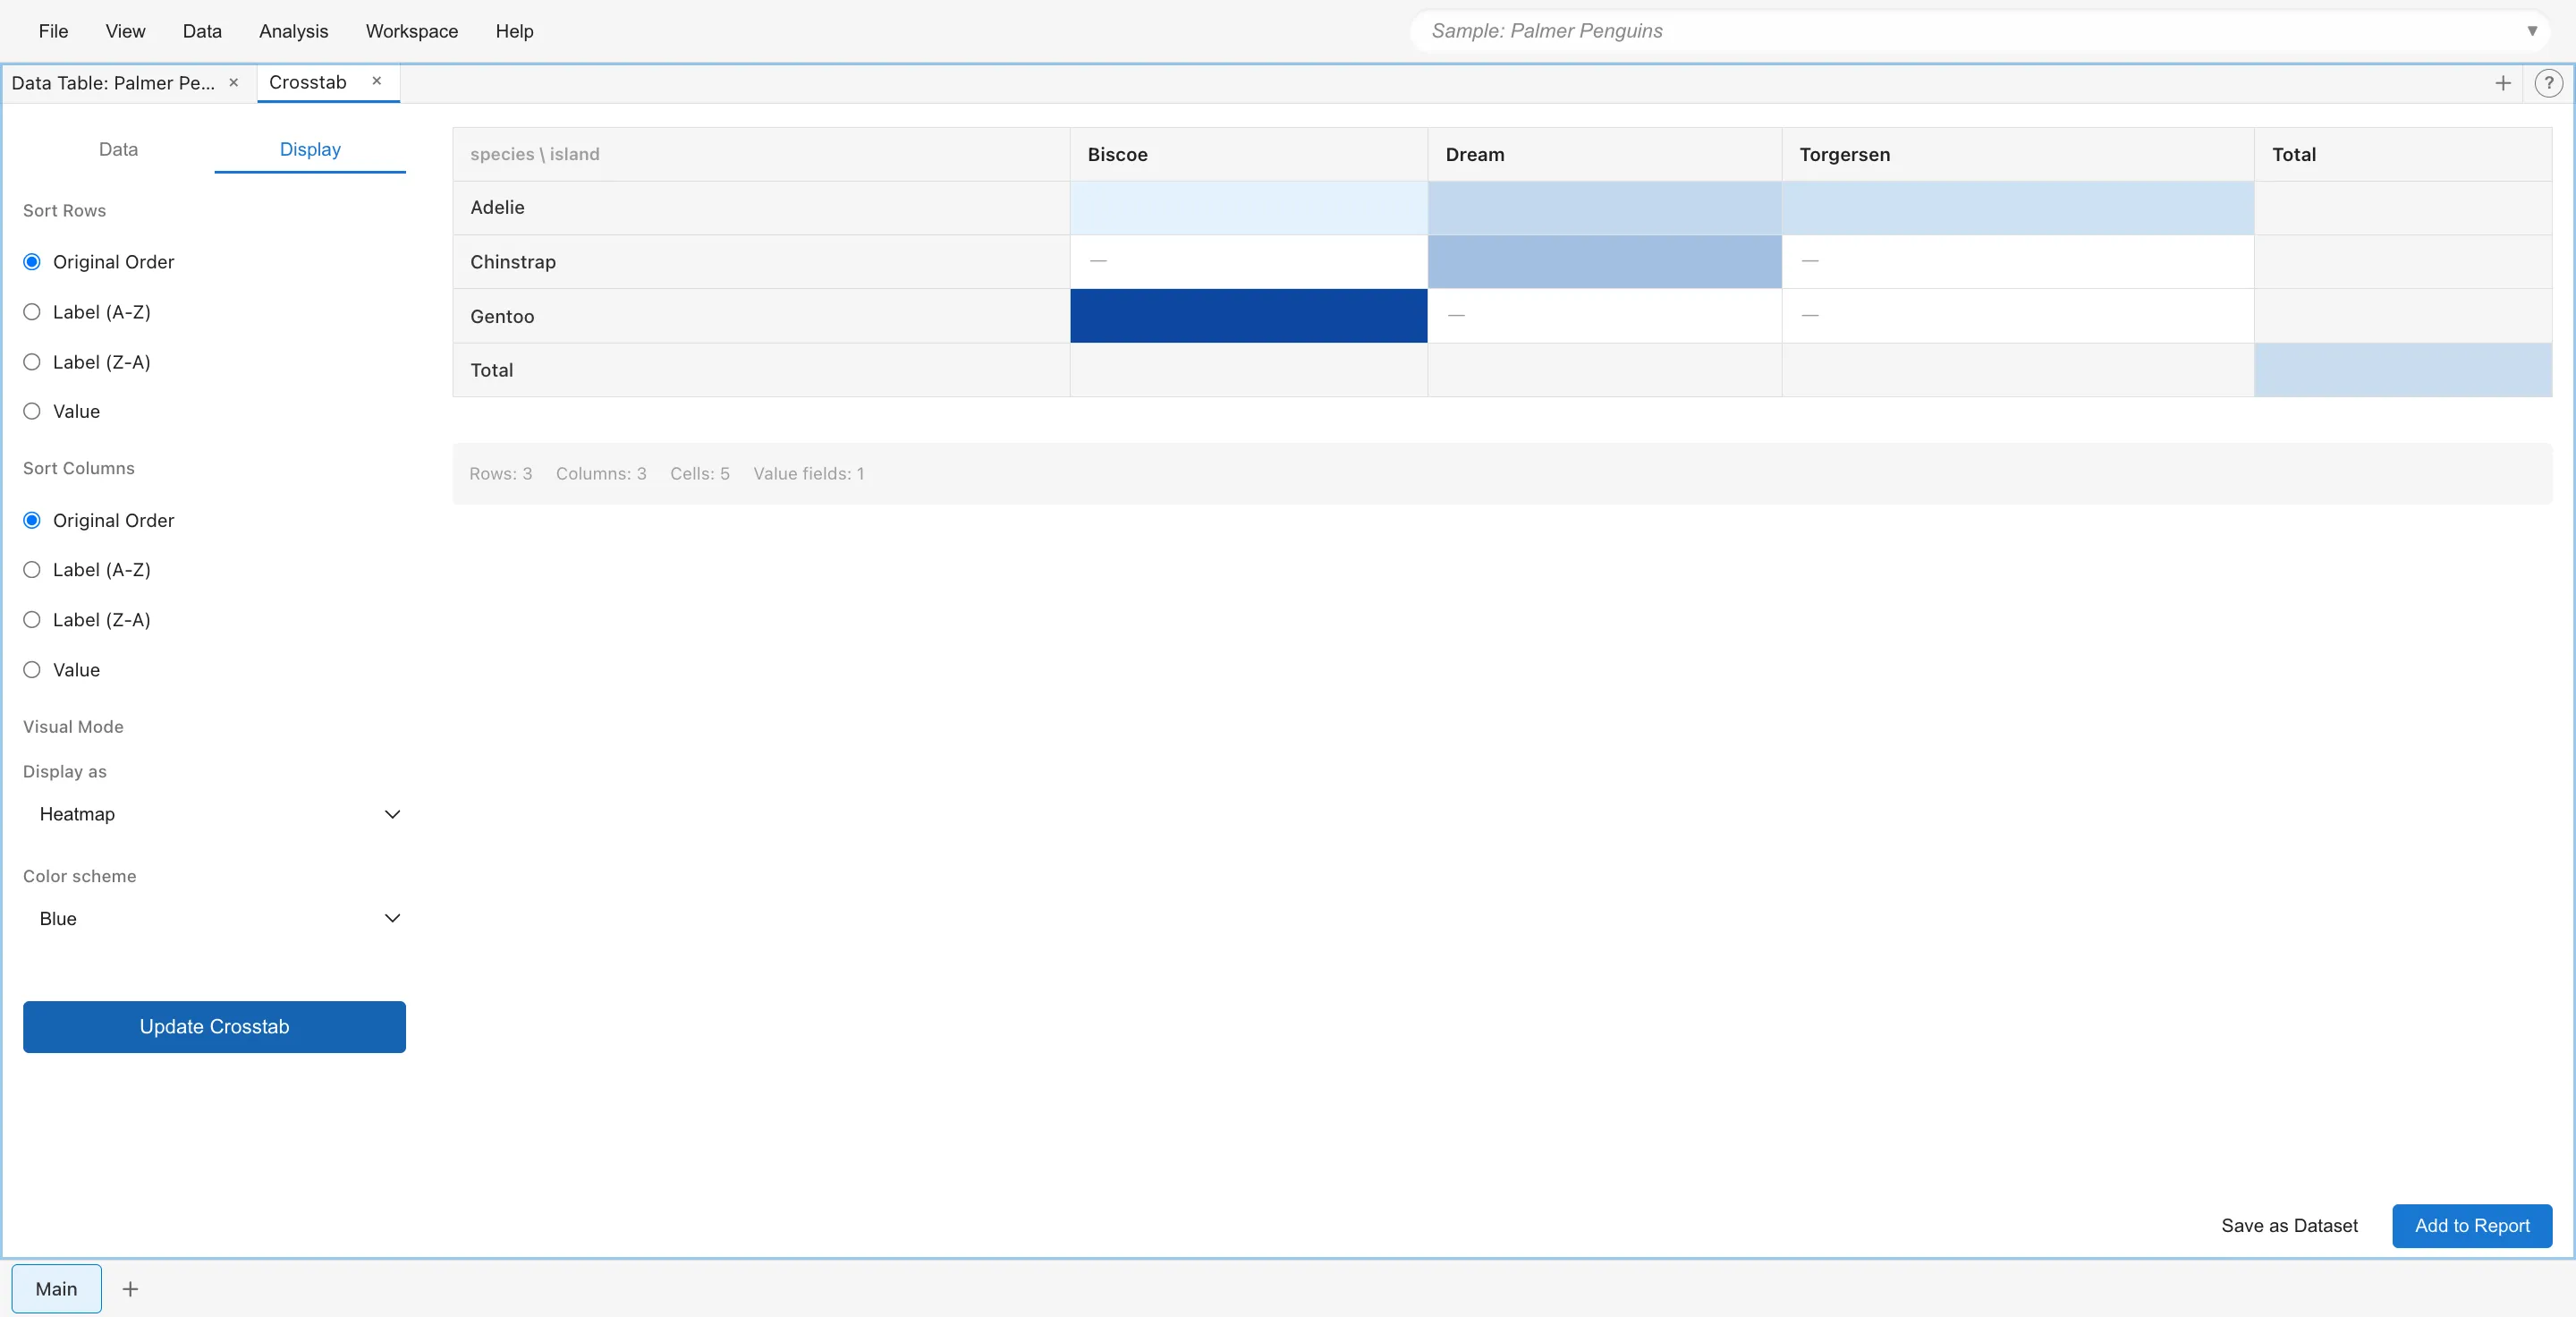
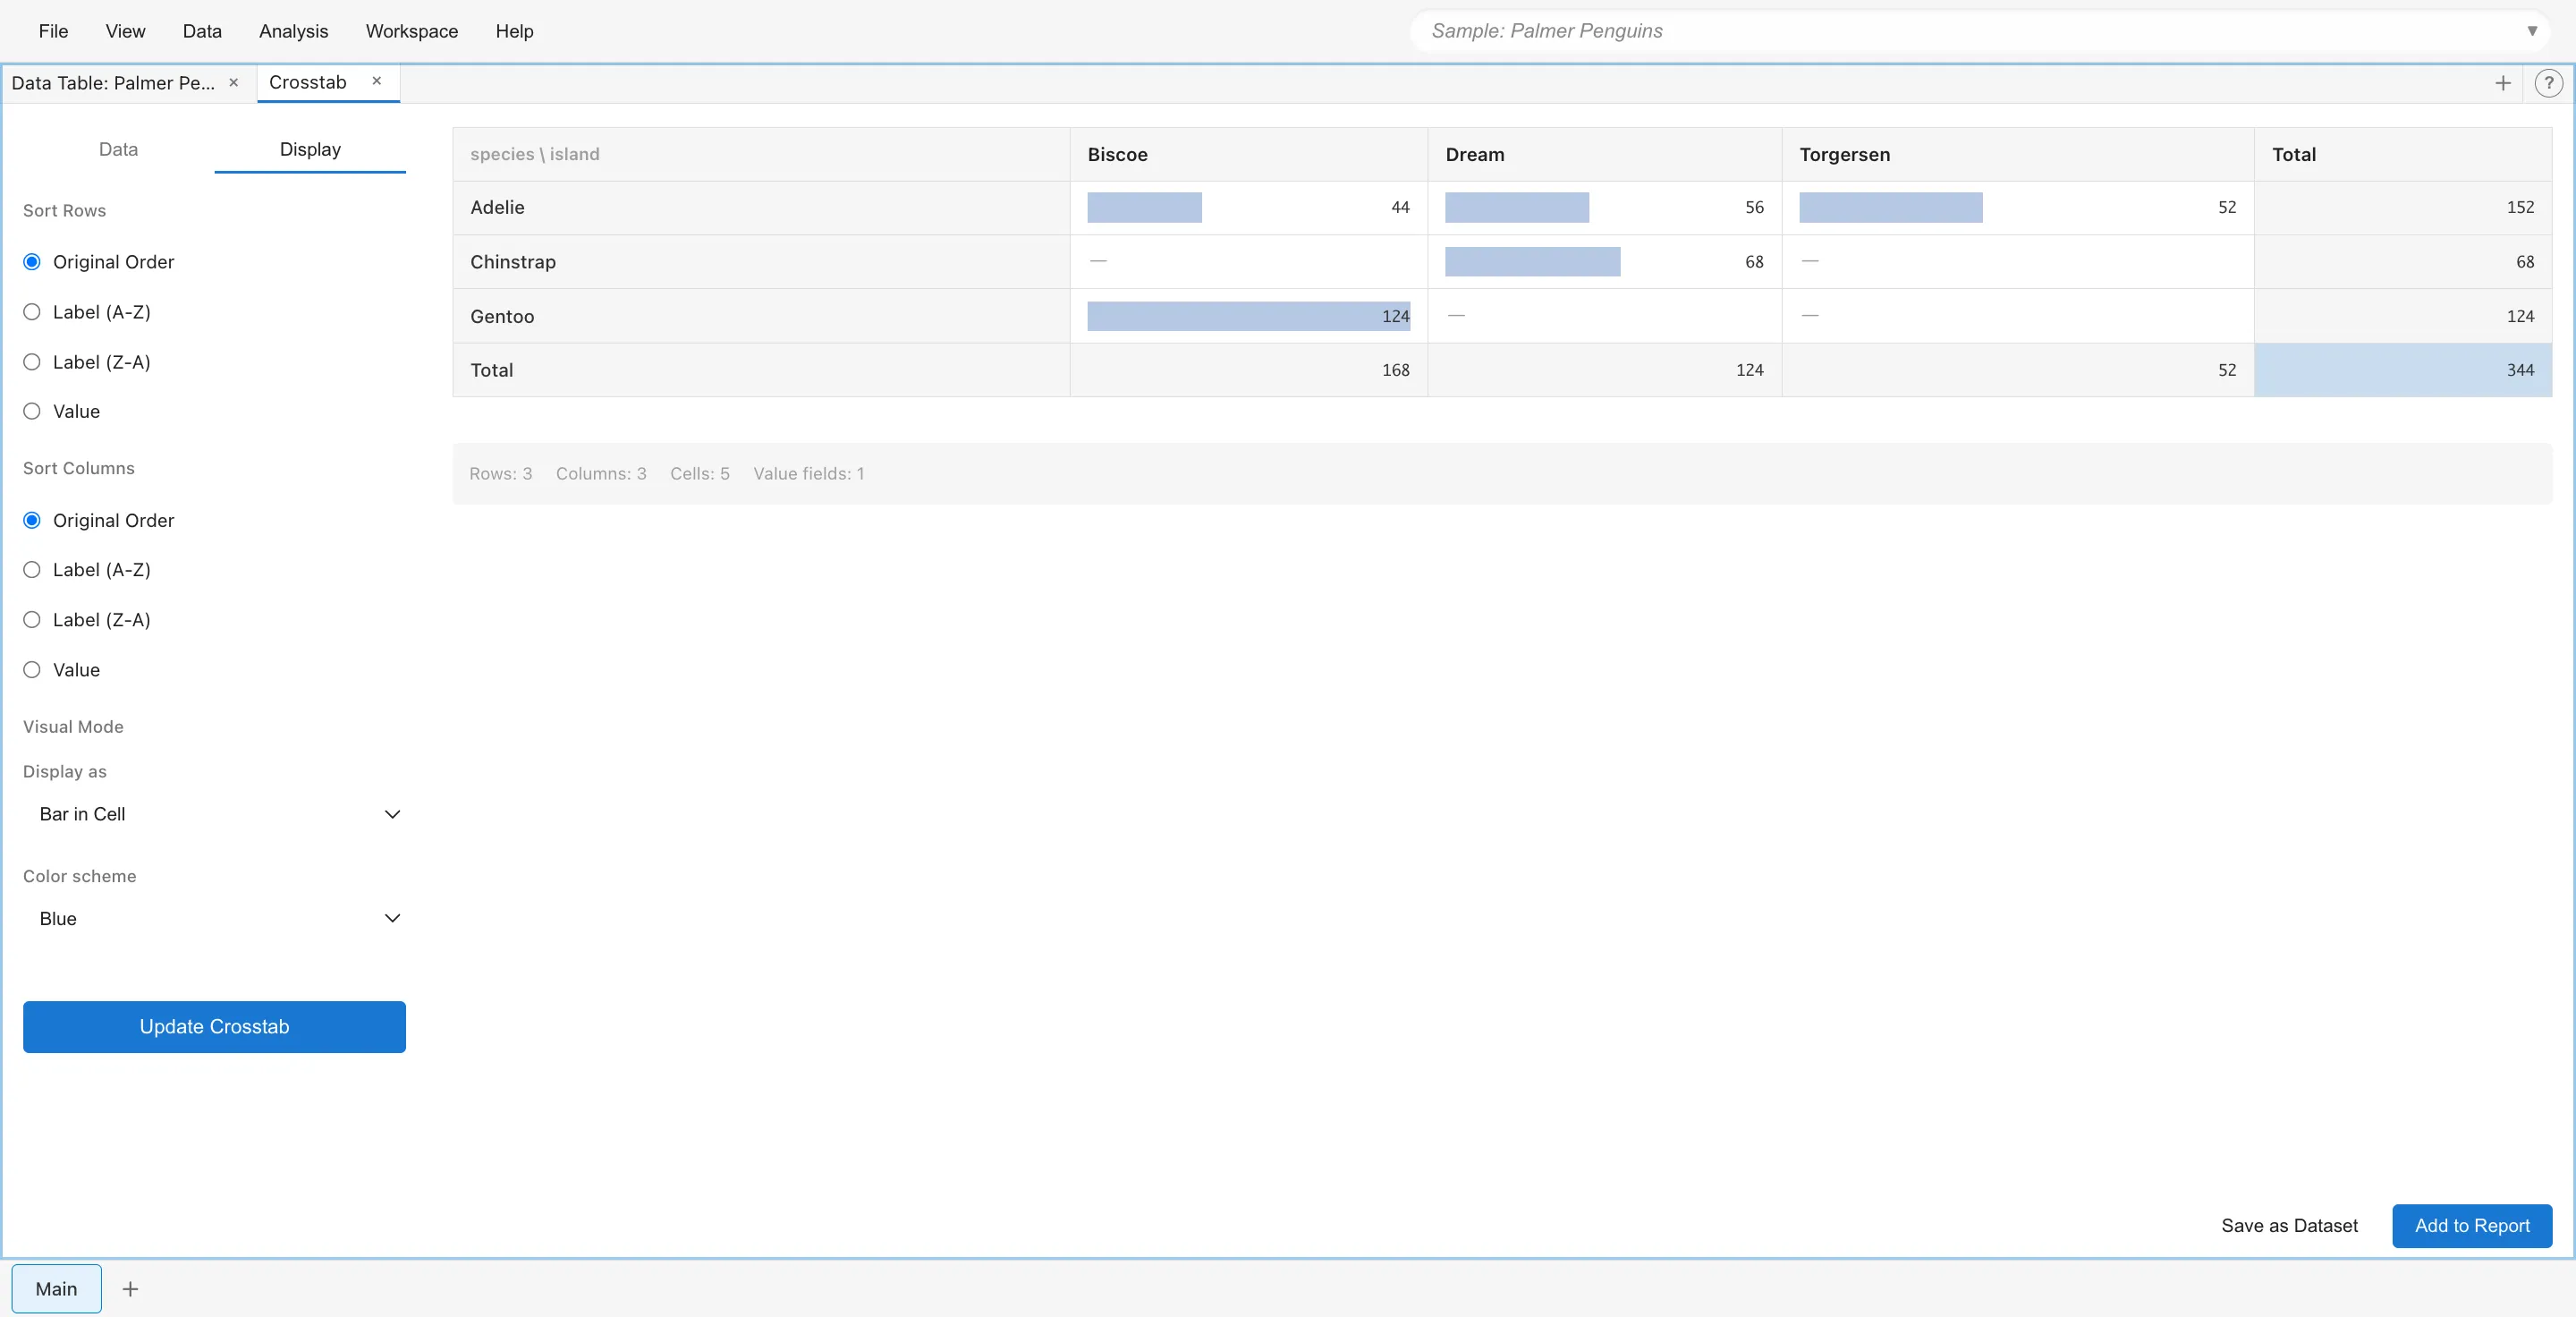
Color Scheme
In heatmap mode, you can select a color scheme.
- Blue - Blue gradient
- Red - Red gradient
- Green - Green gradient
- Diverging - Gradient from red through white to blue
Cell Operations
Cell Selection
Clicking a cell selects the original data rows corresponding to that cell. Selected rows are highlighted in other views as well.
Drill Down
Double-clicking a cell opens a Filtered Data tab with only the data matching that cell's criteria.
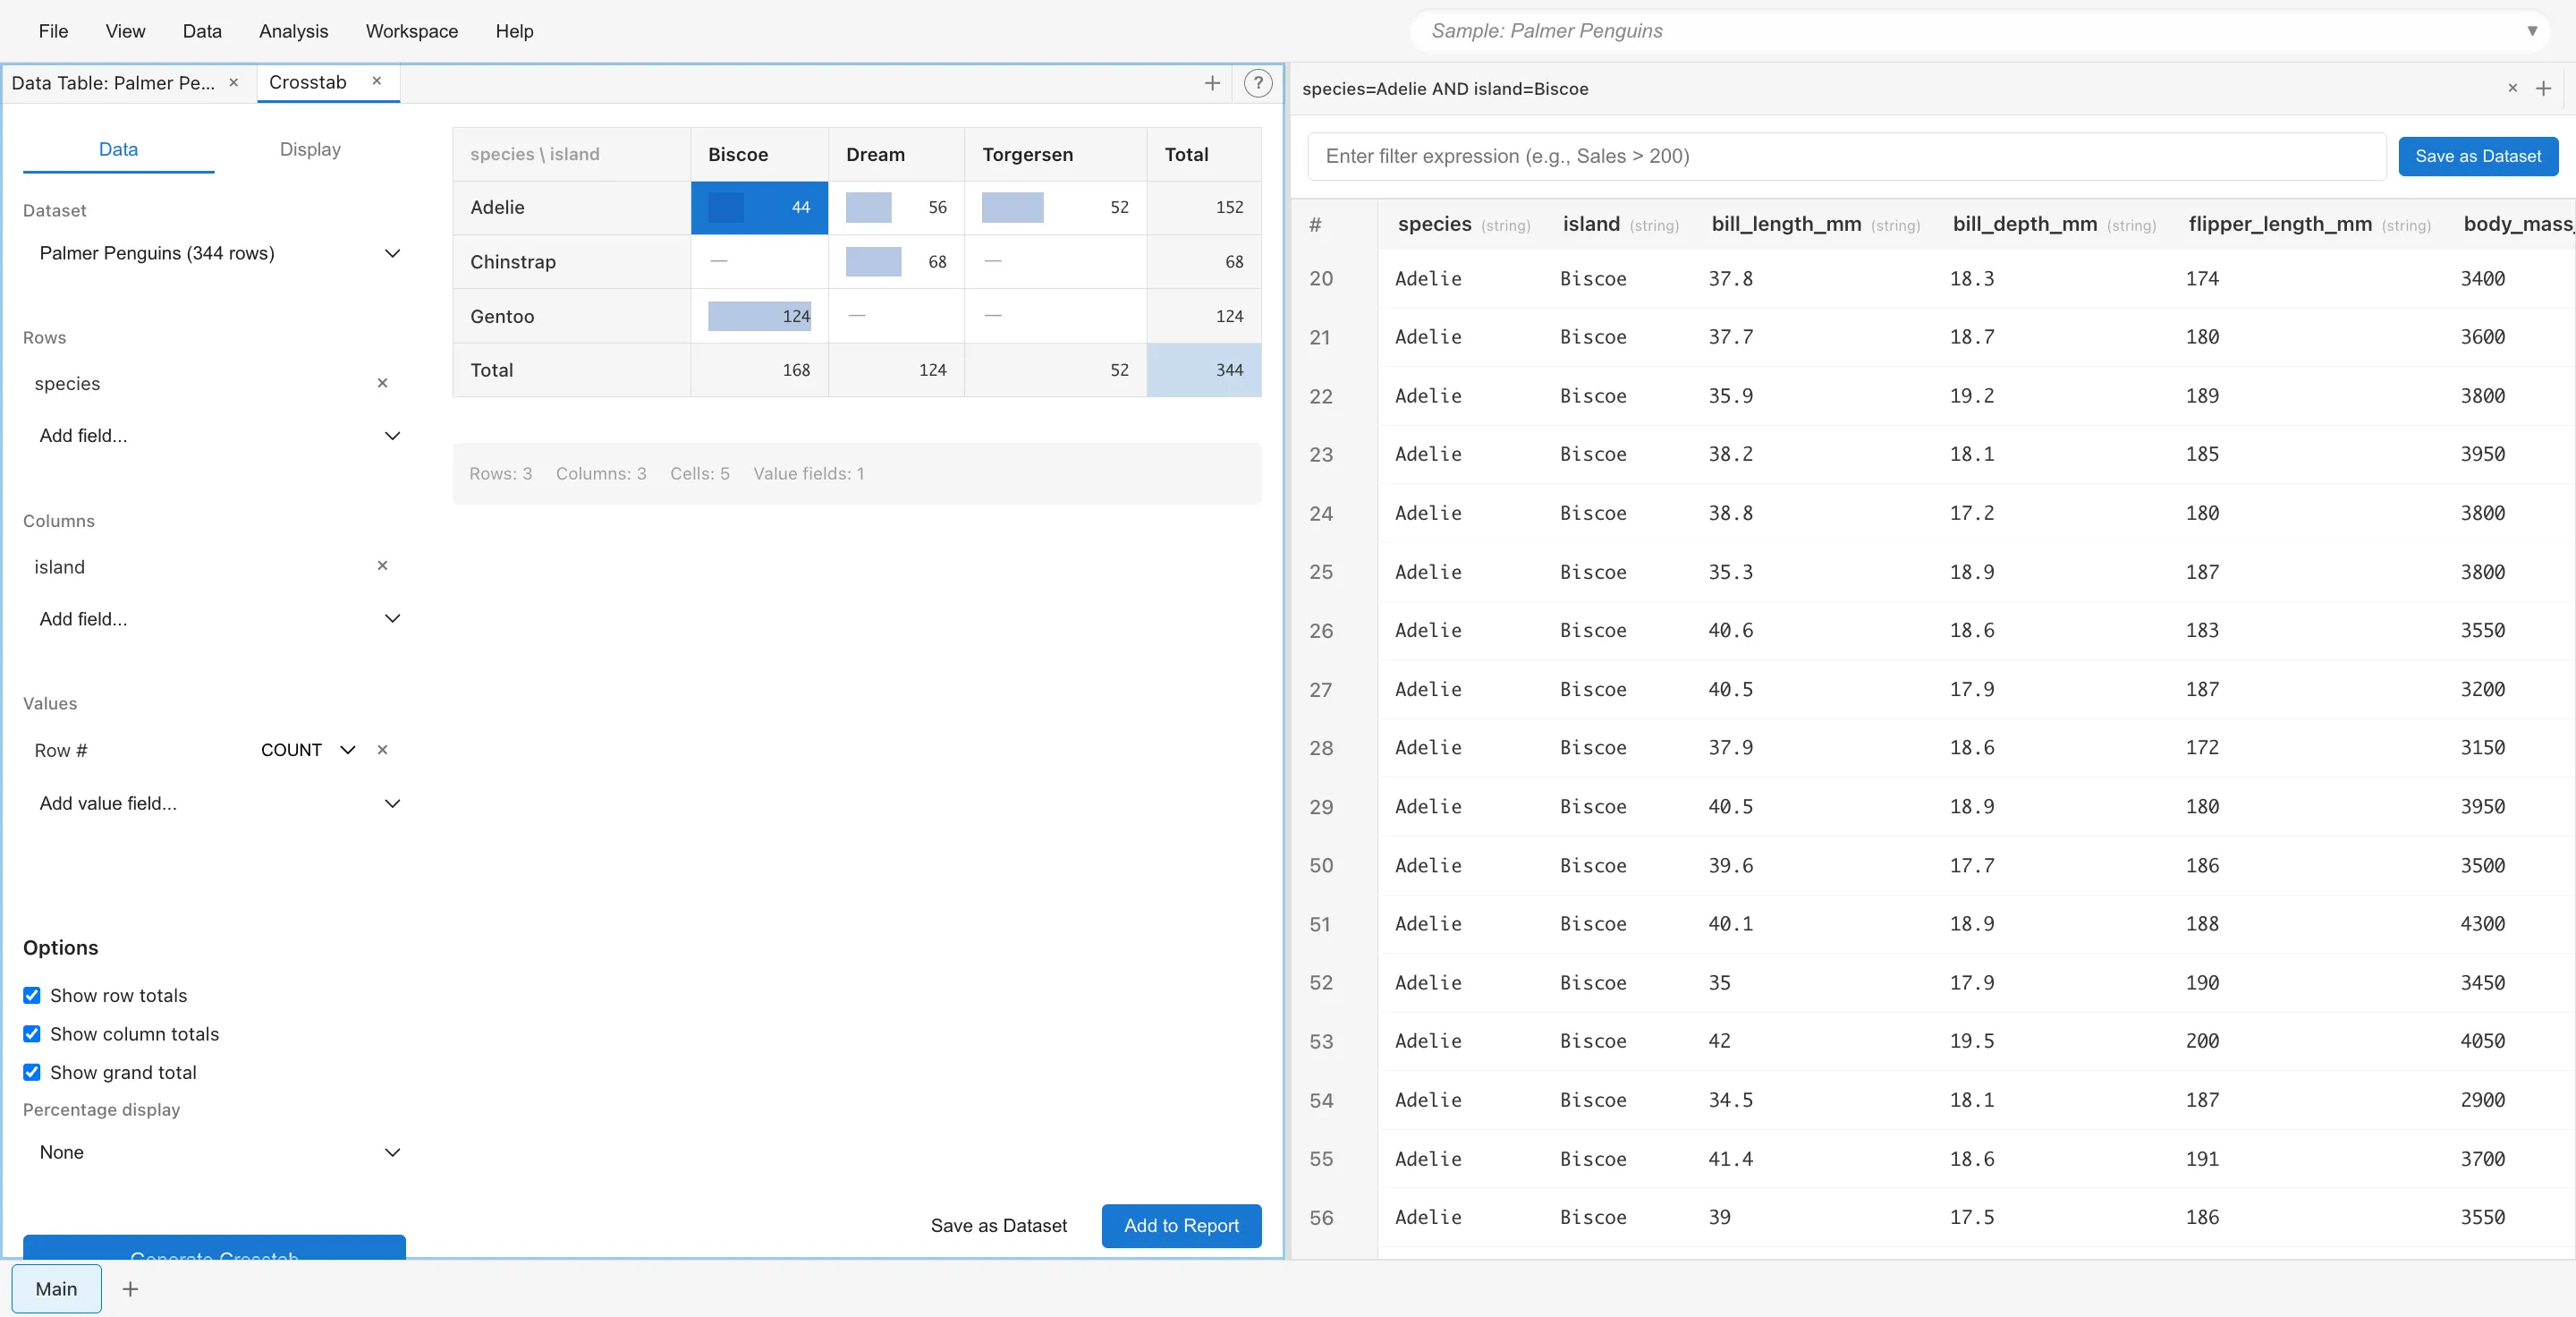
In the Crosstab on the left, double-clicking the "44" cell (Adelie x Biscoe) opens a Filtered Data tab with the 44 rows matching those criteria. The right side shows the Filtered Data tab.
Multiple Value Fields
Adding multiple fields to Values expands each column by value field. For example, if you specify SUM(Sales) and AVG(Profit), the aggregated values for each are arranged under each column header.
When using multiple value fields, visual modes (heatmap, etc.) are not available.
Limitations
Visual modes (Heatmap, Text + Heatmap, Bar in Cell) are only available when there is one value field. When there are multiple value fields, standard Table mode is displayed.